Analytics & Control Center
See what’s happening. Predict
what’s next.
ConcertCloud’s Control Center isn’t
just a dashboard — it’s your command tower.
From real-time audience data to
post-show revenue breakdowns, you’ll see every performance through a sharper
lens.
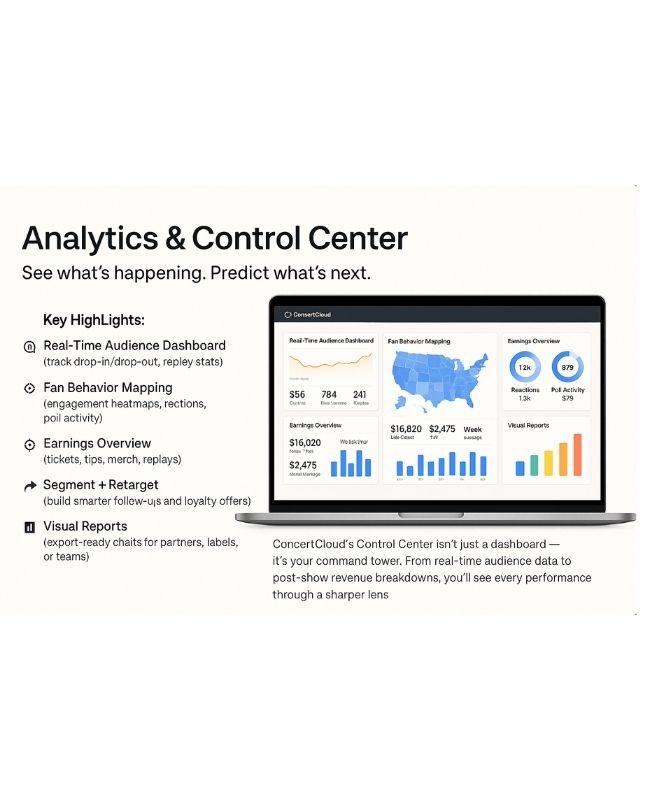
Key Highlights:
-
Real-Time
Audience Dashboard (track drop-in/drop-out, replay stats)
-
Fan Behavior Mapping
(engagement heatmaps, reactions, poll activity)
-
Earnings Overview
(tickets, tips, merch, replays)
-
Segment + Retarget
(build smarter follow-ups and loyalty offers)
- Visual Reports (export-ready charts for partners, labels, or teams)
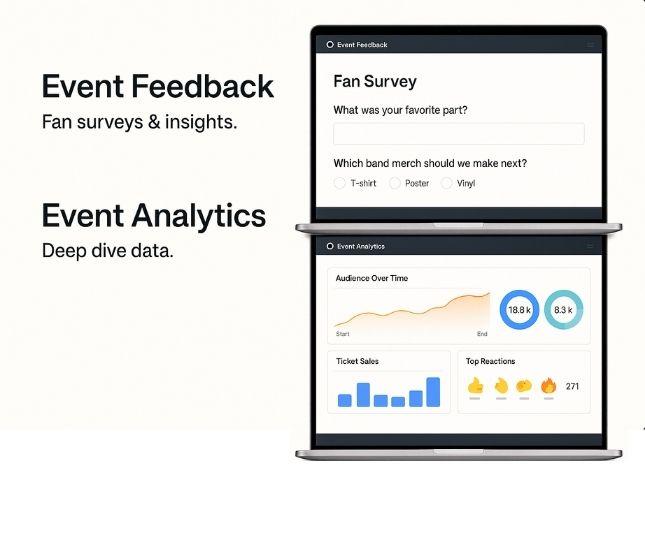
Live Performance Stats
Every set tells
a story. Read it as it unfolds.
-
See live attendance counts
+ drop-off moments
-
Track which songs get the most
reactions
- Highlight most-tipped or highest-engaged segments
-
Auto-flag crowd favorites for
replay or promo
- Perfect for on-the-fly decisions or real-time shoutouts
Fan Segments
& Behaviors
One audience, many mindsets. Let’s map them.
-
Segment by
engagement type (chatters, voters, tip-givers, lurkers)
- Group fans based on replay activity, poll responses, or merch interest
-
Build automated
campaigns by segment
- Turn viewers into superfans with smarter insights
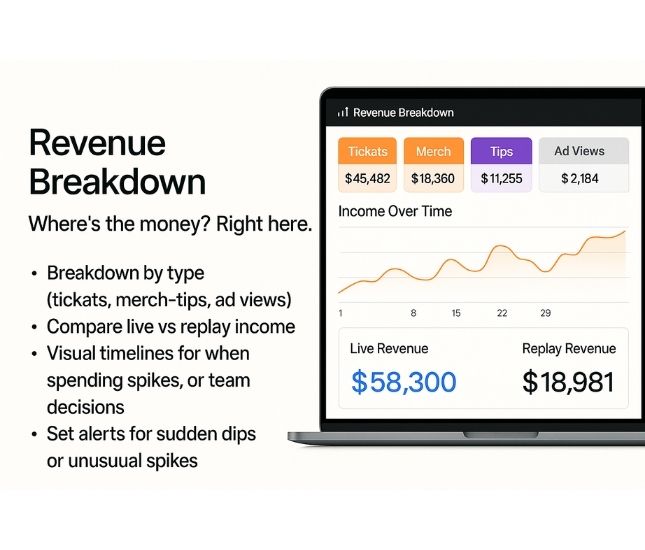
Revenue
Breakdown
Where’s the money? Right here.
-
Breakdown by
type (tickets, merch, tips, ad views)
-
Compare live vs
replay income
-
Visual timelines of
when spending spikes
-
Export reports for
sponsors, agents, or team decisions
-
Set alerts for
sudden dips or unusual spikes
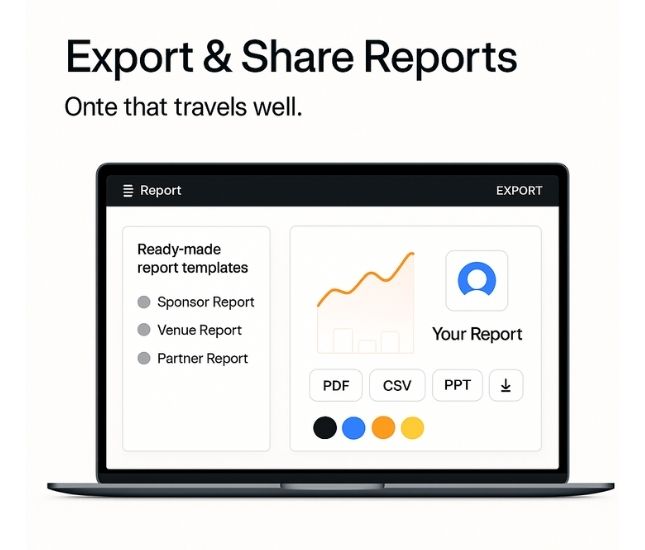
Export
& Share Reports
Data that travels well.
-
One-click
exports (PDF, CSV, PPT)
-
Ready-made report
templates (for sponsors, venues, or partners)
- Embed charts into press kits, pitch decks, or recap emails
- Custom branding for your reports (logo, colors, voice)